These days, you probably spend a lot of time looking at and thinking about data. However, due to the vast amount of data that you encounter, you may not be thinking about that data critically. This might put you in a reactive mode, making knee-jerk or even misguided decisions.
Many of the leaders with whom I work struggle to think critically about their data. They either dismiss it outright (e.g., “Our data is never credible anyway”) or accept it at a surface level and try to make decisions from discrete, incomplete facts. But, it’s not entirely their fault.
Our brains aren’t optimized to work with data. In fact, our mind often gets in the way.
A famous example of this is the “Invisible Gorilla” experiment by Dan Simons and Chris Chabris (If you haven’t experienced this experiment, click on the link and play the video). The experiment shows how we can miss information that is right in front of us. At the other end of the spectrum, Roger Shephard created an illusion, “Turning the Tables”. In this illusion, you actually see something that isn’t there – a difference in the size of two equally sized parallelograms.
These two examples counter the common myth that the main barrier to good decision making is having the right data in front of you. Good data is important. But often the data is there, it’s just being misinterpreted.
Instead, a good leader must have the ability to think critically about what he or she is seeing. Critical thinking isn’t the same as analytical thinking or problem solving. It’s easy to fall into the trap of doing either without thinking critically.
Critical thinking is thinking about what and how you are thinking. It’s a type of reasoning through which a person challenges his or her own understanding, beliefs, attitudes, and interpretations as well as those of others. What makes critical thinking difficult is that it requires acknowledging an element of uncertainty to our judgments. The result is continual scrutiny of a topic by questioning its validity. This doesn’t mean that you should fall into “analysis paralysis”. But it does mean that you should look beyond the first reasonable answer to find the most legitimate answer.
Leaders who just take data at face value often miss the important insight hidden deep within the context surrounding that piece of data.
What is your data telling you?
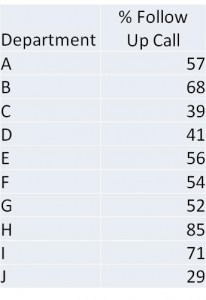
One organization’s customer service survey asked customers if they received a follow-up call after service was rendered. The company had a target of 80% follow-ups. The results from the survey looked like this:
Most of the leaders to whom I show this data come to two conclusions:
1) The company, in general, should put more effort into making follow-up calls
2) Departments G, D, C, and J, in particular, need to step up their follow-up call activity.
Sound reasonable? It might be, but it also might be totally wrong.
A common critical thinking error is taking a metric’s name or a report’s column heading too literally. Therefore, a good first critical question to ask is what specifically the data represent.
In this case, you might think that answer is obvious – it’s the percentage of follow-up calls being made. But that’s not quite correct.
Remember, these data come from responses on the customer satisfaction survey. Therefore, they are a measure of the number of customers who reported receiving a follow-up call, not the number of calls placed. Any calls made after the customer took the survey are not included. Or, suppose that customers define a follow-up only as a call in which they actually spoke with someone. Voicemail messages would also be discounted.
Telling managers to step up the number of calls might result in confused looks. Their staff might be following up 100% of the time. However, they might just be leaving messages or making the calls after the surveys are completed.
Does it matter?
Suppose that the leader determines that his or her people are not adequately making follow-up calls. At that point, does it make sense to put more resources into improving the numbers? After all, they aren’t hitting their target. But, a critical look at the data might tell a different story.
Before committing resources to increasing follow-up calls, it makes sense to challenge that assumption that in every area follow-up calls have a positive impact on the business (note: if this has already been proven, there is no need to re-create the wheel. However, often practices are adopted because they seem reasonable as opposed to having been proven effective). Otherwise, you might be optimizing a metric that doesn’t matter.
Generally it’s hard to find an insight with just one discrete fact. Insights come from finding relationships and relationships require at least two pieces of data. The customer satisfaction survey has a lot of data aside from the follow-up call question. The leader also has access to data outside of the survey. So, why limit yourself to drawing conclusions from just one number?
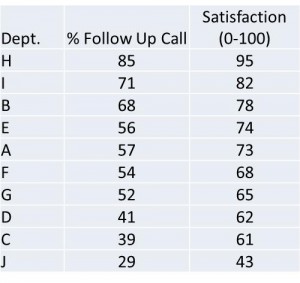
The following table compares the rate of follow-up calls (as reported by the customer) and customer satisfaction. The second column shows the percent of time that customers report receiving a follow-up call after service is rendered. The third column shows the average level of customer satisfaction. (0 is worse, 100 is best).
What does this data tell you? What would you do with it?
At face value, the data seem to be pretty clear – more follow-up calls leads to more satisfaction. Or do they?
Confusing correlation and causality is another common and dangerous critical thinking mistake. This often happens because our brains are wired to find connections, even when they might not exist. The leader who jumps to the conclusion that follow-up calls impact satisfaction and therefore advocates for more follow-up calls is falling into this trap.
Instead, the leader needs to challenge that natural assumption of causality. He or she can do this by asking two critical questions about the nature of the relationship:
a) Do follow-up calls impact satisfaction, or
b) Are follow-up calls just one of many things that high-performing departments do?
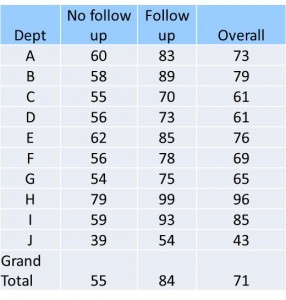
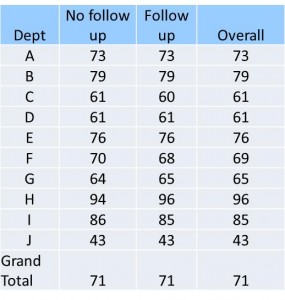
A quick and simple test can answer the question. Instead of just comparing the number of follow-ups to the level of satisfaction, the leader can compare satisfaction in those people who receive calls and those who do not. If there is a difference, then there is causal relationship. If there isn’t a difference, then it is just a simple correlation. The following tables show these two different scenarios. The second column in each table shows the average satisfaction level among those who did not report receiving calls. The third column shows the average satisfaction level among those who did receive calls. The final column shows the average overall satisfaction for the department.
Scenario 1: Causal Relationship
In this scenario, there is evidence that follow-up calls impact satisfaction. Therefore, putting more resources into making follow-up calls is probably a good idea. But, that might not always be the case. The next scenario would provide the same high-level results (overall relationship between follow-up calls and satisfaction). However, it tells a very different story.
Scenario 2: Simple Correlation
In this case, while there is a correlation between follow-up calls and satisfaction, there is no causal relationship. Increasing follow-up calls would have little impact on the business (other than the negative impact of wasting resources that could be put on higher impact activities). In fact, according to this data, increasing follow-up calls in departments C, F, and I could actually have a negative impact on the business (although slight). A better response would be to monitor calls in those departments to find out why they might be making customers less satisfied. Note the use of the word “might”. This is another opportunity to think critically and not jump to the conclusion that the calls are reason for the lower satisfaction.
You can do all of the thinking and testing described in this essay in a matter of minutes. It doesn’t take long or require a lot of additional analysis to think about data more critically. It just takes discipline, practice, and a different mindset.
You are probably already asking questions when looking at your data. Critical thinking just changes some of those questions. It also requires an understanding of your business and your metrics. If you find yourself trying to make decisions off of your high level reports, take a step back. Learn to ask critical questions to ensure that you understand what the data is telling you. Ask enough questions so that you don’t see things that aren’t there or miss things that are.
Having good data is important. But understanding that data and being able to question it and find insights is more important.
Brad Kolar is the President of Kolar Associates, a leadership consulting and workforce productivity consulting firm. He can be reached at brad.kolar@kolarassociates.com.


