You might be thinking that I got the title backward. Isn’t the old expression “seeing is believing”? Maybe so, but it’s not accurate. The reality is that very often our experience and expectations have a greater impact on how we view information than the other way around.
For example, which lottery ticket has a greater chance of winning?
2, 5,16,18, 27, 36
1, 2, 3, 4, 5, 6
Statistically, both have the same chance as every number has an equal probability of being chosen. Was that a surprise? For some it might have been; others already knew the answer. But let’s take it one step further. Suppose that I was holding each ticket and told you that you could only take one. Which would you choose? Most people when asked this question take the first ticket. Even those who come into the exercise with an understanding of the statistics tend to make that choice.
People tell me that they’ve never seen the numbers 1,2,3,4,5,6 before (or any consecutive set of winning numbers). Despite knowing the statistical answer, the fact that we haven’t experienced a consecutive number causes to reshape our view of the data and conclude that it is less likely. As it turns out, no one has ever seen 2, 5, 16, 18, 27, or 36 before either but that’s not as obvious so we discard that fact when thinking through the issue. Believing is seeing – what we have seen or expect to see changes what and how we perceive the information in front of us.
Las Vegas exploits this phenomenon to lull gamblers into a false sense of security. The electronic display next to a roulette table shows the numbers that have been spun recently. As with the lottery, every number on a roulette wheel has an equal chance of winning. Each spin is independent. If the number five comes up six times in a row it still has the same chance of coming up on the seventh spin as does any other number. But our brains trick us – when was the last time you saw the same number come up seven times in a row? The casinos make us think they are helping us by providing all of this extra data. In reality, they are exploiting the fact that believing is seeing. The data isn’t helping the gambler make a better bet, it’s causing him or her to make a higher bet by (falsely) increasing the gambler’s sense of confidence.
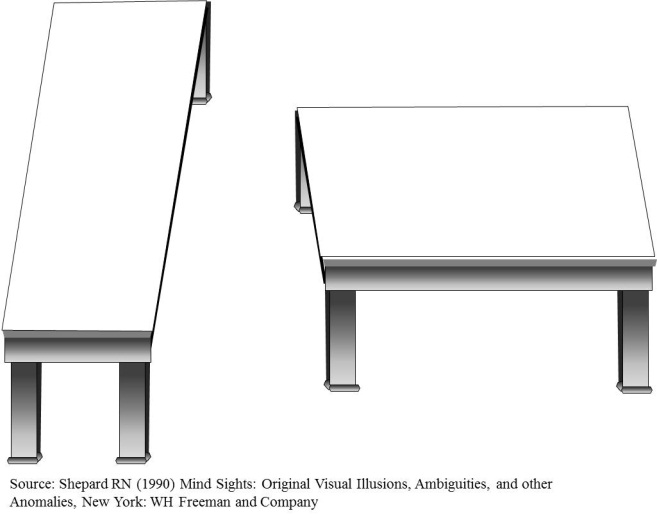
Another classic example of the believing is seeing phenomenon is Roger Shephard’s table illusion. Look at the two tables in the picture.
Measure the length and width of each one. They are the same. Yet, even after you verify this you still won’t be able to make yourself see them as the same. The image hitting your retina and registering in your brain (e.g., the data) is of two equally sized parallelograms. However, you don’t see with your eyes. You only take in data with them. Your brain combines that visual data with your past experience to create the image that you “see”. Everyone has experienced perspective. Things in the distance look smaller than things that are closer. When you look at the Shephard illusion, your brain is trying to reconcile the data and experience. And, as is often the case, it is allowing your experience literally to shape your view of reality – believing is seeing.
Finally, in his book “How we decide”, Jonah Lehrer describes how this phenomenon resulted in a group of rats outperforming a group of Yale students in an experiment.
In the experiment, researchers randomly placed food on one side of a T-shaped maze. While the individual placement was random, the experiment was designed so that the food would be placed on the left side 60% of the time. The rats quickly learned the trick and started going to the left thus achieving a 60% success rate overall. The students didn’t fare as well. They only found the food 52% of the time. The problem was that the students were convinced that there was a pattern and used that “knowledge” in their predictions. But as Lehrer pointed out, “The problem was that there was nothing to predict; the apparent randomness was real.” But believing is seeing. The students believed that there was a pattern. Most likely, their brains overemphasized those instances in which they guessed correctly and under-emphasized when they were wrong. This resulted in them continuing to see a pattern that just wasn’t there.
How often does your experience with a person shape the way you view their current behavior. When one of the “superstars” on your team doesn’t perform up to par, do you re-evaluate your opinion of him or her? Or, do you find yourself looking for reasons (excuses) to explain the poor performance forcing the data to conform to your experience.
If two people come late to a meeting, one a high performer and one a low performer do you treat their tardiness the same? Or do you assume that the high performer was just really busy while the low performer was slacking off as usual.
Do you over-emphasize events or facts that confirm your biases while ignoring those that refute them?
Leaders often tell me that if they could just have the right data in front of them, they’d be able to make good decisions. Yet, I don’t think it’s that simple. The problem isn’t in seeing the right data. The problem is in seeing the data (in the) right (way).
Believing is seeing. Take time to think critically and challenge your assumptions and conclusions about your data. You might be surprised at what you find out.
Brad Kolar is the President of Kolar Associates, a leadership consulting and workforce productivity consulting firm.


